
Blog


Stray Light Analysis
Stray light is the presence of unintended (and generally unwanted) light paths in your optical system which become a source of noise in the measured optical signal. These paths can be generated by events such as scattering from optical or mechanical surfaces and/or ghost paths (reflections from nominally transmissive surfaces).
FRED’s powerful suite of tools has been developed over multiple years to make it simple to find these paths - making FRED an indispensable tool for Stray Light Analysis.
This article discusses several FRED features to simulate and identify Stray Light in your system including:
- Detailed Raytrace Controls
- How to generate ray paths
- The Raytrace Paths Report
- Filtering with Ray Filters and the ‘Analysis Lasso’ filter
- The Stray Light Report
Straylight From Ghost Rays in an Objective
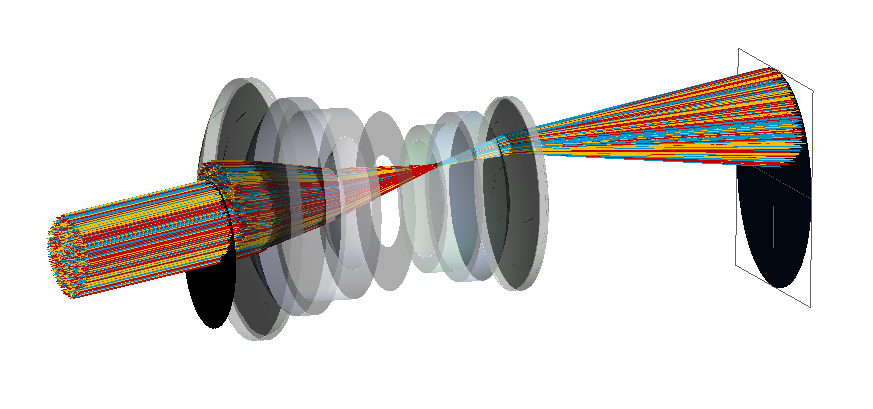
When considering any optical system, such as an objective lens, there is both an intended design path, and the unintended real paths that rays can take.


Figure 1. Intended design path on left. Unintended Stray Light paths on the right where allowed ray ancestry = 2.
There are infinitely many unconstrained paths - each inbound parent ray can generate many child rays as the rays split at partially reflective or scattering surfaces, and so it is required to reduce the size of the problem to make it manageable in a simulation by applying some limits. This is an area where FRED’s Raytrace Controls excel.
FRED’s Raytrace Controls allow you to choose:
- what combinations of actions are allowed at each surface.
- how far down the ancestry tree the ray trace is allowed to proceed.
- how many total intersections are allowed.
- termination threshold energy.
It is possible to create multiple Raytrace controls to cater for different situations and for different surfaces to be subject to different controls. Because FRED applies these choices at the individual surface level this places maximum flexibility in your hands. We can, for instance, apply one raytrace control to the first group of lenses and a second raytrace control allowing for a greater depth of ray ancestry (i.e. more ray splitting) for the second group of lenses near the detector.
However, even in the case where we limit the trace to two levels of ancestry, as seen in the right hand image above, we still have a lot of rays to study. FRED simplifies the study of Stray Light using Raypaths.
What are Raypaths?
Raypaths group rays by the set of interactions that they have in common - each unique set of interactions becomes a raypath and these provide the fundamental basis for Stray Light Analysis. To request that FRED saves the ray history and sorts those rays into paths is a simple matter of checking two boxes in the Advanced Raytrace options prior to tracing rays.

Figure 2. Advanced Raytrace options to create raypaths and store ray history.
As a simple example consider the following Mach Zehnder interferometer in an idealized configuration which provides four possible paths that the rays can follow.

Figure 3. A simple example displaying the four principle paths of an idealized Mach Zehnder Interferometer
Raytrace Paths Report
Going back to our objective lens - using Raytrace controls to allow a deeper level of ancestry (more ray splitting) in the optics nearer the lens, FRED finds 1260 paths. The Raytrace Paths Summaries table provides further information regarding the numbers and types of interaction (e.g. transmission vs reflection, specular vs scatter) and some critical metrics such as the total power of the rays within the raypath.

Figure 4. The Raytrace Paths Summaries table.
FRED enables the user to perform several operations from this table, such as:
- Listing out the detail of a path (the order and events the surfaces are interacted with)
- Drawing a specific path in the 3D view (such as those drawn in Figure 3)
- Saving a path as a user defined path for subsequent sequential analysis
- Isolating and Drawing the surfaces interacted with on a specific path
Even simple systems can generate a lot of paths and it’s often not feasible to individually review them all. To handle the large numbers of paths that can be generated FRED provides additional tools to sift through the data and hone in on the paths that matter the most.
Filtering Raypaths
FRED’s Ray Selection Filter capabilities have long been an essential and powerful tool for the analysis of the complex paths rays can take through optical systems. Ray filters can be applied at numerous places throughout the software - including the Raytrace Paths Summaries table.
When faced with an optical system with lots of paths, such as the ghosting generated in an objective lens, if we have a particular set of interactions we may be interested in then we can build a set of filters to find those paths. For instance, we may be interested in the ghost rays generated by the final lens “Lens 10-11”, the highlighted filter can find these paths for us.

Figure 5. Raytrace Paths Summaries table filtered for ghost rays generated by the last lens (surfaces 10 and 11)
And of these three paths we can choose to plot the rays that make it to the image plane (Last Entity = surface 12) which in the case above is path 126.

Figure 6. 3D view showing rays from path 126, ghost rays from the last lens that contribute to the image.
Stray Light Report
Whilst the Raytrace Paths Summaries report can find any general path, FRED also has a specific report called the Stray Light Report that is dedicated to studying stray light from scattering and ghost reflections. This report facilitates the viewing of paths that end up on the designated receiver surface and can be filtered by ancestry level and event type, such as double bounce ghosts, and helpfully lists the ghost surfaces.

Figure 7. Stray Light Path Report showing double bounce ghosts and surfaces involved.
And further filters can also be applied to this report.
The Interactive Lasso Filter
However, it’s more often the case that the paths causing problems are not known and in this situation the Lasso Filter can be used on an analysis result. Plotting Irradiance on a log scale shows the stray light contribution around the focal spot.

Figure 8. Interactive Lasso filter applied to an irradiance analysis on the image plane
By drawing a bounding box around this region interactively with our mouse FRED can display the paths that contributed to this area.

Figure 9. Output window showing the results of the paths which fall within the interactive lasso filter.
And the Raytrace Path Summaries table can be used to draw these paths in the layout.

Figure 10. Three largest ghost paths rendered on 3DView

Figure 11. Three largest ghost paths filtered on Analysis Surface displaying Irradiance
Summary
FRED provides several tools to help the optical designer understand the source of straylight in their optical systems.
Contact us to request a Demo of FRED or talk through your application needs in more detail.